




View all reports & guides
Report
2027 Hard Hat Workforce Economics Report
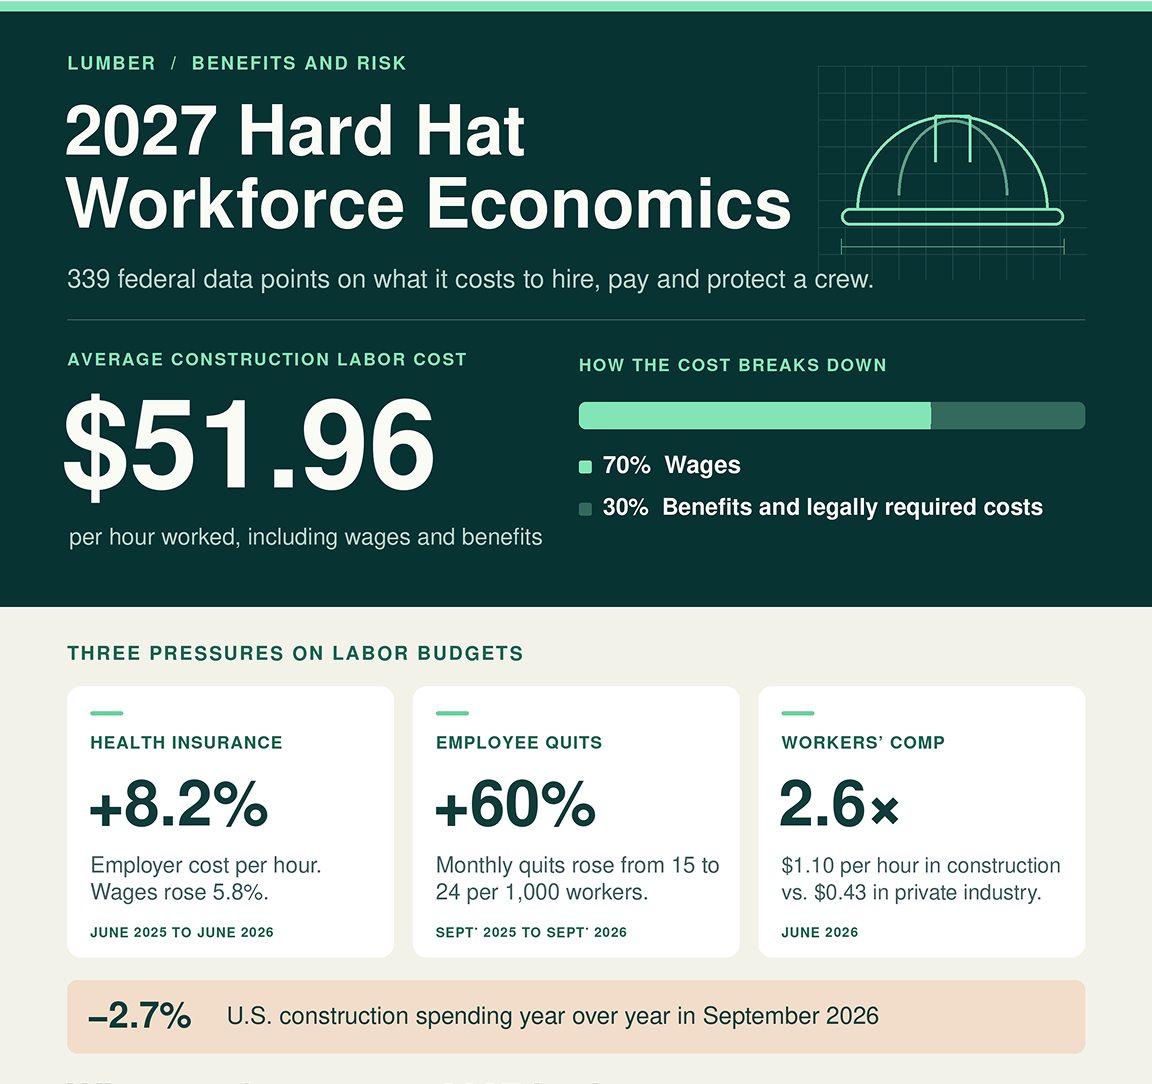
Your labor budget starts with an hourly wage. The full cost also includes benefits, workers’ compensation, and the expense of replacing people who leave.
This report analyzes 339 federal data points to show where construction labor costs are rising, how they compare with private-sector benchmarks, and where employers can look for more control.

What you will find inside:
Key insights on
The full cost of an hour worked. See how wages, benefits, payroll taxes, and workers’ comp add up, and how construction compares with the private sector
Health benefits benchmarks for renewal season. Compare premium costs and what employers and employees each pay for single and family coverage.
Hiring and turnover trends. See where construction employment is growing or shrinking, and what jb openings, quits, and layoffs signal for your retention plans.
Wage and injury benchmarks by trade. Compare pay across occupations and see where injury rates are highest, from framing and concrete to plumbing and HVAC.
Five actions for your 2027 budget. Use the findings to set wage assumptions, plan benefits renewals, manage workers’ comp, and track total labor cost per hour worked.
+ BONUS GIVEAWAY! 🎉

Get your personalized AI roadmap
Let our AI experts will analyze your existing systems and craft a personalized AI integration roadmap tailored to your business goals.
How do your labor costs stack up?
Compare your wages, benefits, and workers’ comp costs with industry benchmarks and see where you can better manage spending.

Supercharge your construction workforce
Talk to our Lumber expert to get started.

Book a demo